Electric vehicle sales can potentially surge by over 60% to 1.6 million units in 2023, the International Energy Agency (IEA) forecasts. It represents a notable year-on-year increase from just 990,000 in 2022.
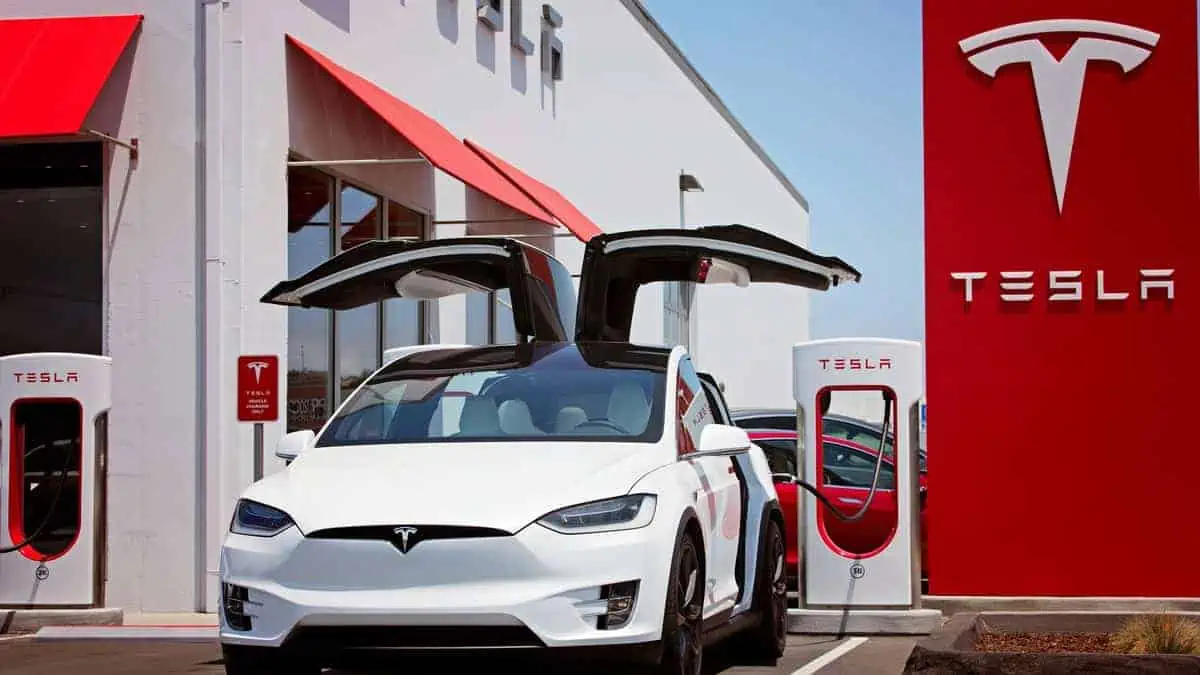
However, the lack of sufficient and reliable charging infrastructures remains the top concern of the industry. Unlike internal combustion engine-powered (ICE) vehicles with enormous infrastructures, EV drivers cannot guarantee that they will locate an available station at the next stop.
Moreover, the number of charging points in the US continues to lag behind the EV growth.
Charging points to EV ratio
Research firm SBD Automotive projects that the US would need a charging point for every 8-12 EVs to have an effective charging network in the coming years.
Notably, SBD and location data firm HERE Technologies primarily leveraged the charging points:electric vehicle ratio to develop the HERE-SBD Automotive EV Index.
USA Today indicated that the majority of US states were under the “sweet spot” for the said ratio in 2020. Two years later, 12 states achieved the car-to-charger ratio. Meanwhile, HERE’s historical data revealed that 24 states had 13 or more EVs for every public charging point.
The report further noted that this single ratio is still insufficient for the rapid growth of EVs in the US as ownership deviates from state to state.
For instance, California’s EV registrations reached 903,600 units last year, while Iowa only had 6,200 EVs. It is unsurprising as California is undoubtedly a larger state than Iowa. Apart from that, EV buyers are concentrated on both coasts rather than in the center of the US. According to the data, every 100 square miles in the state has 580 EV registrations, while Iowa only has 11.
Alarmingly, 50% of the states with the highest EV registrations have no sufficient public charging points.
New Jersey’s advantage against most states
New Jersey has 30 EVs for every charging station. Nonetheless, that is just one of the key criteria in defining a successful EV infrastructure development.
The report stated that the state landed at the bottom of the EV index’s cars-to-chargers metric. However, it got in the top 12 in the HERE-SBD Automotive EV Index. Refer to the table below:
| Area | Rank |
| EV market share compared to conventional vehicles | 7th |
| The ratio of charging points to miles of roads in a state | 9th |
| Average power of EV charging station | 21st |
It must be noted that the index ranked all 50 US states and Washington DC from 0 to 25 according to the four abovementioned metrics.
Rankings
Presented below are the HERE-SBD Automotive EV Index’s data on the leading and lagging states in terms of EV demand and charging infrastructures:
See Also:
- Nearly 50% of US car buyers intend to buy an EV, but concerns over charging infrastructures remain
- Tesla Magic Dock Supercharger starts US testing, enabling charging for other EVs
- Select Tesla Superchargers to provide recharging to non-Tesla EVs in Australia
- S&P Global Mobility: Public EV Charging Stations must quadruple in United States by 2025
- Increase number of EVs in the US requires more charging stations by 2030
The HERE-SBD Automotive EV Index can significantly aid customers planning to buy an electric vehicle. The location data company also launched a useful map that displays the number of available charging stations in each county.


