The largest contributor to climate change is transportation, and the industry emits 30% of carbon dioxide emissions in the U.S. The government has been encouraging people to switch to electric vehicles. It is perhaps the best strategy to reduce the carbon footprint caused by Internal combustion engine vehicles.
LeasePlan USA has released a state-by-state E.V. Readiness Index Study that reveals how prepared each state is for the electrified future. Few states are considered E.V. accepted, most of the states are considered E.V. progressive, and a few others are falling behind.
The E.V. readiness index has a 1-5 ranking considering various factors that effectively grade a state’s preparedness for an electrified future. The index ranks the states based on five factors:
- Favorable state legislation and incentives
2. E.V. Penetration
3. Charger to Vehicle Ratio
4. Charger Availability
5. Climate Suitability
Three states are considered “E.V. accepted”: Nevada, Mississippi and Hawaii. These three states have a perfect score of 5 for climate suitability and average scores for other factors.
The study stated that Nevada ranks as no. 1 as the state has made “significant commitments to improving public E.V. infrastructure, highlighted by the construction of the Nevada Electric Highway along U.S. 95 between Reno and Las Vegas.” It is also consistent in scores across all factors.
However, the study shows that no U.S. state is considered “E.V. ready.”

FIFTY U.S. STATES RANKED (INCLUDING WASHINGTON D.C.):
Each state is listed below and is ranked from the most E.V. ready to the least E.V. ready:
| U.S. State | EV Readiness Score | 1. Laws & incentives | 2. EV penetration | 3. Charger to vehicle ratio | 4. Charger availability | 5. Climate suitability | |
| 1. | Nevada | 15.5 | 2 | 2 | 1 | 3 | 5 |
| 2. | Mississippi | 15 | 1 | 1 | 3 | 3 | 5 |
| 3. | Hawaii | 15 | 1 | 3 | 1 | 2 | 5 |
| 4. | Massachusetts | 14.5 | 2 | 2 | 2 | 4 | 3 |
| 5. | California | 14.5 | 5 | 3 | 1 | 1 | 5 |
| 6. | North Carolina | 14.25 | 2 | 1 | 1 | 3 | 5 |
| 7. | South Carolina | 14 | 1 | 1 | 1 | 3 | 5 |
| 8. | Alabama | 14 | 1 | 1 | 1 | 3 | 5 |
| 9. | Georgia | 14 | 1 | 1 | 1 | 3 | 5 |
| 10. | Louisiana | 14 | 1 | 1 | 1 | 3 | 5 |
| 11. | Arizona | 14 | 2 | 2 | 1 | 2 | 5 |
| 12. | Missouri | 13.5 | 1 | 1 | 3 | 4 | 3 |
| 13. | New York | 13.5 | 3 | 1 | 2 | 4 | 3 |
| 14. | Wyoming | 13 | 1 | 1 | 5 | 3 | 3 |
| 15. | Dist. of Columbia | 12.75 | 1 | 2 | 2 | 3 | 3 |
| 16. | Texas | 12.75 | 2 | 1 | 1 | 2 | 5 |
| 17. | West Virginia | 12.5 | 1 | 1 | 4 | 3 | 3 |
| 18. | Colorado | 12.5 | 2 | 2 | 1 | 3 | 3 |
| 19. | Tennessee | 12.5 | 1 | 1 | 1 | 3 | 4 |
| 20. | Florida | 12.5 | 1 | 1 | 1 | 2 | 5 |
| 21. | Utah | 12.25 | 1 | 2 | 1 | 3 | 3 |
| 22. | Kansas | 12 | 1 | 1 | 3 | 3 | 3 |
| 23. | Maine | 12 | 1 | 1 | 3 | 3 | 3 |
| 24. | Rhode Island | 12 | 1 | 1 | 3 | 3 | 3 |
| 25. | Arkansas | 12 | 1 | 1 | 3 | 3 | 3 |
| 26. | Iowa | 11.5 | 1 | 1 | 2 | 3 | 3 |
| 27. | Oklahoma | 11.5 | 1 | 1 | 2 | 3 | 3 |
| 28. | Connecticut | 11.25 | 2 | 1 | 1 | 3 | 3 |
| 29. | Maryland | 11.25 | 2 | 1 | 1 | 3 | 3 |
| 30. | Virginia | 11.25 | 2 | 1 | 1 | 3 | 3 |
| 31. | Michigan | 11 | 1 | 1 | 1 | 3 | 3 |
| 32. | Ohio | 11 | 1 | 1 | 1 | 3 | 3 |
| 33. | Nebraska | 11 | 1 | 1 | 1 | 3 | 3 |
| 34. | Indiana | 11 | 1 | 1 | 1 | 3 | 3 |
| 35. | Pennsylvania | 11 | 1 | 1 | 1 | 3 | 3 |
| 36. | New Hampshire | 11 | 1 | 1 | 1 | 3 | 3 |
| 37. | Delaware | 11 | 1 | 1 | 1 | 3 | 3 |
| 38. | Kentucky | 11 | 1 | 1 | 1 | 3 | 3 |
| 39. | New Mexico | 11 | 1 | 1 | 1 | 3 | 3 |
| 40. | New Jersey | 11 | 2 | 2 | 1 | 2 | 3 |
| 41. | Oregon | 11 | 2 | 2 | 1 | 2 | 3 |
| 42. | Washington | 11 | 2 | 2 | 1 | 2 | 3 |
| 43. | Vermont | 10.5 | 2 | 2 | 3 | 3 | 1 |
| 44. | North Dakota | 10 | 1 | 1 | 5 | 3 | 1 |
| 45. | Illinois | 9.5 | 1 | 1 | 1 | 2 | 3 |
| 46. | South Dakota | 9 | 1 | 1 | 3 | 3 | 1 |
| 47. | Montana | 8.5 | 1 | 1 | 2 | 3 | 1 |
| 48. | Wisconsin | 8.25 | 2 | 1 | 1 | 3 | 1 |
| 49. | Minnesota | 8.25 | 2 | 1 | 1 | 3 | 1 |
| 50. | Alaska | 8 | 1 | 1 | 1 | 3 | 1 |
| 51. | Idaho | 8 | 1 | 1 | 1 | 3 | 1 |
U.S. State E.V. Readiness Score
1. Laws & incentives
2. E.V. Penetration
3. Charger to vehicle ratio
4. Charger availability
5. Climate suitability
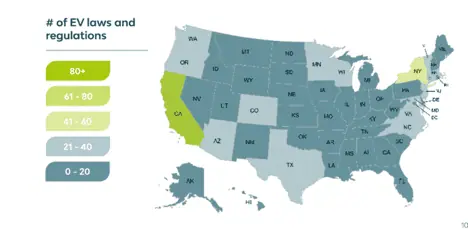
Of all U.S. states, only California has a perfect score of 5 for the Law and Incentives. The state has 134 legislation and purchasing incentives, while New York is second with 42 and a score of 3. The study stated that “A great example from California is the Plug-In Electric Vehicle (PEV) Rebates for Fleet Vehicles offered by the Sacramento Municipal Utility District (SMUD). SMUD offers rebates to businesses for the purchase of new commercial light-, medium-and heavy-duty PEVs, ranging from $750 per vehicle for Class 1-2b and passenger vehicles, up to $15,000 per vehicle for Class 8 assets.”
The least E.V. ready U.S. States are Alaska and Idaho. Both states scored 1 in every factor except for Charger Availability which both States scored 3. These states may need more push from their local government to promote the use of Electric Vehicles.
Both Wisconsin and Minnesota are also at the bottom of the list, with both having a score of 8.25.
More details about the study here.
